Amazon Business Reports are a cornerstone for sellers aiming to succeed in the competitive Amazon marketplace. These reports are hosted within Seller Central, offering bunch of data that can provide insights into sales trends, customer behavior, traffic metrics, and inventory performance..
At its core, the purpose of Amazon Business Reports is to help sellers answer crucial questions like:
- Which products are driving the most revenue?
- How are customers interacting with your listings?
- Where should you focus your advertising dollars?
- Are there bottlenecks or missed opportunities in your business model?
For example, sellers who regularly analyze Business Reports often discover patterns that lead to smarter decisions. Studies suggest businesses that adopt data-driven strategies are 23 times more likely to acquire customers and 19 times more likely to achieve profitability.
By learning to interpret Amazon Business Reports, you gain control over every aspect of your Amazon business—from optimizing product listings to planning inventory and beyond.
How to Access Amazon Business Reports?
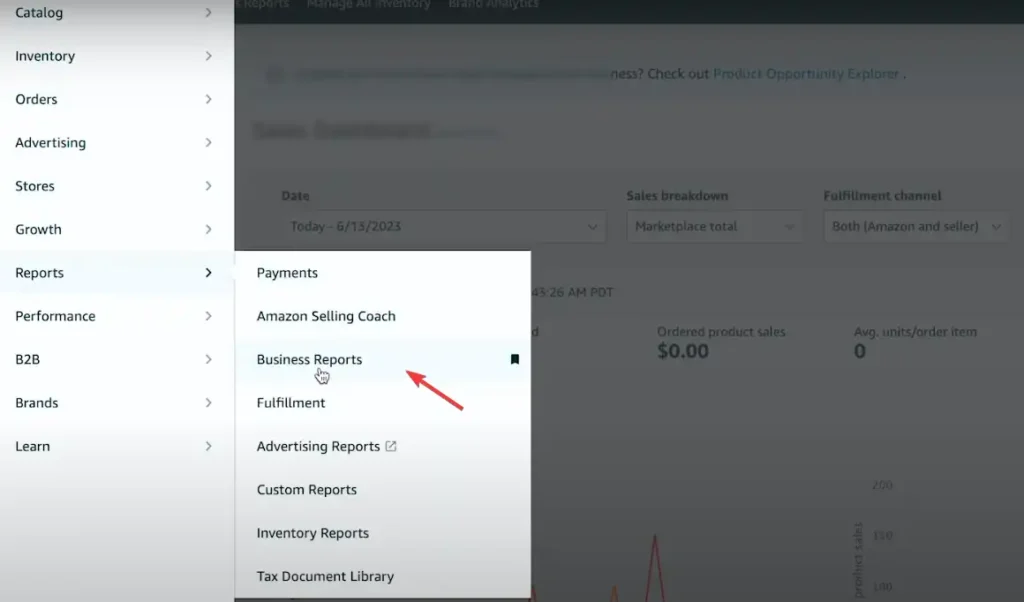
Amazon Business Reports can be accessed from the Reports tab in Seller Central. After logging in, locate the “Business Reports” option. This will open a dashboard containing various metrics and tools for slicing and dicing your data.

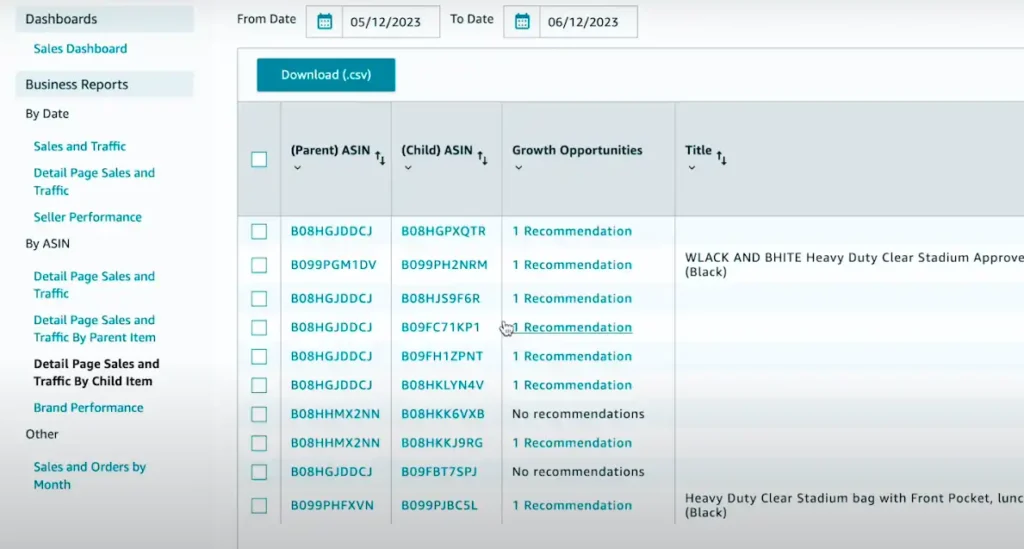
If you want to perform deeper analysis or integrate your data into third-party tools, Amazon allows you to download these reports in CSV format. Tools like Microsoft Excel or Google Sheets enable you to create pivot tables, generate graphs, or run custom analyses. Sellers often use downloaded data to track their performance over time, helping to identify sales dips or traffic spikes linked to promotional campaigns.
Types of Amazon Business Reports and Their Purpose
The Sales Dashboard
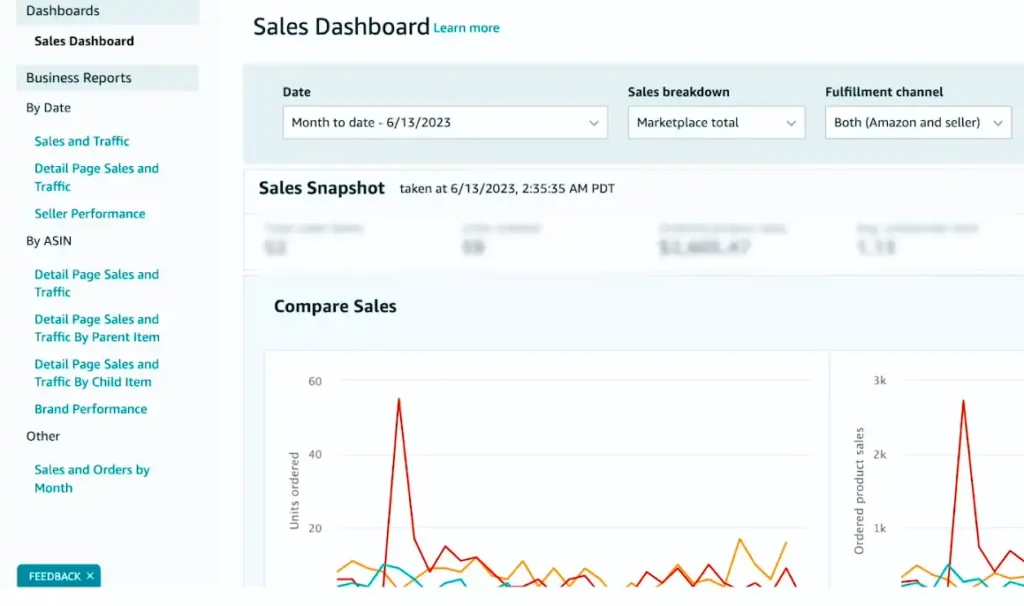
The Sales Dashboard is a quick snapshot of your store’s overall performance. It features metrics like total sales revenue, units ordered, and average order value for different timeframes—daily, weekly, monthly, or even custom periods.

For instance, if your total revenue yesterday was $1,500 but your average daily revenue is $2,000, you can investigate potential issues like stockouts or a drop in traffic to certain listings. Sellers can also use the Sales by Category section to understand which product categories are driving growth.
Reports by Date
The “By Date” section of Business Reports allows you to analyze data on specific timeframes. The Sales and Traffic Report is one of the most commonly used tools here. It tracks:
- Page views: How many times your product detail pages were visited.
- Sessions: The number of unique visits to your listings.
- Units ordered: Products sold during the selected period.
For example, a product receiving 10,000 page views but only 300 units ordered has a conversion rate of 3%, which may signal issues with pricing, reviews, or product content.
Reports by ASIN
The ASIN-specific reports provide granular insights into your catalog. The Detail Page Sales and Traffic by Parent Item report groups metrics by product families, while the Child Item report dives into individual variations like size or color.

Suppose you sell a T-shirt in five colors. If black accounts for 60% of total sales, you might allocate more inventory to this variant. This information helps not only with stock management but also with planning advertising campaigns to highlight top-performing variations.
Metrics You Should Track and Interpret
Interpreting Amazon Business Reports boils down to understanding the key metrics and what they reveal about your performance.
Sales Metrics
- Units Ordered: The total number of products purchased. For example, a spike in units ordered during November may indicate the impact of Black Friday promotions.
- Gross Sales vs. Net Sales: Gross sales include shipping and other fees, while net sales focus solely on product revenue. Sellers typically aim for year-over-year sales growth of 20–30% to stay competitive.
- Average Order Value (AOV): AOV helps you understand how much customers spend on average. Strategies like bundling can help increase this metric.
Traffic Metrics
- Page Views and Sessions: These metrics show how many people are viewing your product pages. A low number of sessions may indicate poor visibility, which could be resolved through better SEO or advertising.
- Conversion Rate: Often expressed as a percentage of sessions resulting in purchases. Sellers on Amazon generally aim for a 10–15% conversion rate, but this varies by category.
Customer Behavior Metrics
- Buy Box Percentage: The percentage of time your product appears in the Buy Box. Products with higher Buy Box percentages tend to experience 30% higher sales than those without.
- Refund Rate: High refund rates can hurt account health. If refunds for a particular product exceed 5%, it’s time to investigate potential issues like misleading descriptions or defective items.
Advanced Insights from Amazon Business Reports
Interpreting Business Reports isn’t limited to sales and traffic metrics. Sellers can also use advanced insights for more strategic planning.
Advertising Reports
Advertising performance metrics like ACoS (Advertising Cost of Sale) and ROAS (Return on Ad Spend) help you understand the efficiency of your campaigns. For instance, if a campaign has an ACoS of 15%, this means you’re spending $0.15 for every dollar of revenue generated. Sellers often aim for an ACoS below 20% for Sponsored Products campaigns to maintain profitability.
Fulfillment Reports
Fulfillment data is especially important for FBA sellers. These reports reveal inventory age, storage costs, and stranded inventory. One seller reduced long-term storage fees by 25% by analyzing inventory age reports and creating removal orders for unsold stock.
How to Use Amazon Business Reports as a Seller
Amazon Business Reports are not just tools for passive observation—they are actionable resources that sellers can use to fine-tune their strategies and achieve measurable results. By applying insights from these reports, sellers can address issues, capitalize on opportunities, and drive sustainable growth.
For instance, imagine a seller offering eco-friendly water bottles who noticed a sharp decline in sessions during Q2 of 2023. Through the Detail Page Sales and Traffic Report, they identified two critical problems: increased competition and a lower Buy Box percentage. Armed with this information, they updated their product listings to include more engaging descriptions and images, temporarily reduced their prices to remain competitive, and launched a Sponsored Products campaign to improve visibility. Within three months, their sessions rebounded, and their revenue grew by 35%.
In another scenario, a seller discovered one of their ASINs had an unusually high refund rate of 8%, which was twice the store’s average. By analyzing customer feedback and refund reasons, they identified the root cause: a misleading product description that created unrealistic expectations. After revising the description to better align with the product’s actual features and managing customer expectations, they saw the refund rate drop to 3% in just one month.
These examples highlight how analyzing and acting on the insights from Amazon Business Reports can help sellers tackle challenges proactively and seize opportunities for growth.
FAQs
How often should I check my Amazon Business Reports?
Weekly reviews are recommended for tracking performance. Monthly deep dives can reveal larger trends and opportunities.
What is the most important metric in Amazon Business Reports?
While all metrics are valuable, conversion rate stands out. It directly impacts sales and signals the effectiveness of your product listings.
Can these reports help reduce my advertising costs?
Absolutely. By analyzing ROAS and ACoS, you can allocate budgets to campaigns that deliver the best returns.
What should I do if my refund rate is high?
Investigate product quality, customer feedback, and listing accuracy. Address these issues to improve customer satisfaction.
Summing Up
Amazon Business Reports are more than just numbers on a screen—they are a roadmap to building a thriving business. By learning to interpret them effectively, you empower yourself to make smarter decisions, optimize your performance, and stay ahead in the competitive Amazon marketplace. Whether you’re tracking sessions, analyzing refund rates, or planning ad campaigns, these reports provide the insights you need to grow and succeed.

